
SkillsHeaven helps businesses measure digital marketing success through clear KPI tracking, campaign performance reporting, and ongoing dashboard setup. If you want to know whether your marketing is working, you need a few core numbers, not dozens of scattered data points. This guide breaks down exactly which metrics matter and how to read them.
Measuring digital marketing success means tracking specific KPIs tied to your business goals, not vanity metrics. Core indicators include conversion rate, click through rate, cost per acquisition, and return on investment. Set these up before a campaign launches, track them in one dashboard, and compare results against clear benchmarks to judge true performance.
What Digital Marketing Success Looks Like for Your Business
Success means something different for every business. A clothing store might define it as sales growth. A law firm might define it as qualified leads. Either way, the starting point stays the same. Pick a goal first, then choose the numbers that prove whether you hit it.
Many businesses skip this step. They launch a campaign first and try to measure it later. Results become hard to judge, since nobody agreed on what success should look like before the campaign began. Set your goal before launch. Then choose two or three KPIs that connect directly to that goal.
Marketing KPIs vs Metrics: Why the Difference Matters
A metric is any number you can track. A KPI is a metric tied to a business outcome. Page views are a metric. Conversion rate is a KPI. This distinction matters because tracking too many metrics creates noise instead of insight.
Your team should agree on a short list of KPIs before measuring anything else. Three to five KPIs per campaign is usually enough. Fewer numbers, watched closely, beat dozens of numbers nobody reviews.
Vanity Metrics to Stop Relying On
Some numbers feel good but rarely connect to revenue. Follower counts, raw impressions, and total page views fall into this group. They are not useless, but they should never sit at the top of a report. A high follower count with low engagement and zero sales tells you little about marketing performance. Track these as supporting context, not as proof of success.
Set Up Tracking Before You Measure Anything
You cannot measure what you have not set up to track. Before launching any campaign, confirm that your analytics tools are recording the right actions.
Connecting Google Analytics and Your Marketing Dashboard
Google Analytics remains the standard tool for tracking website traffic, user behavior, and conversion events. Connect it to your site early, well before your first campaign goes live. Feed that data into a marketing dashboard so your team can see performance in one place instead of switching between tools. This single step prevents the most common reporting gap businesses face, data that exists but never gets reviewed.
Defining Goals and Conversion Events First
A conversion event is any action that matters to your business. A form submission, a phone call, a completed purchase. Define these events inside your analytics tool before your campaign starts. Skipping this step means you will have traffic data but no way to tell which visitors actually became customers.
The Core KPIs That Show Campaign Performance
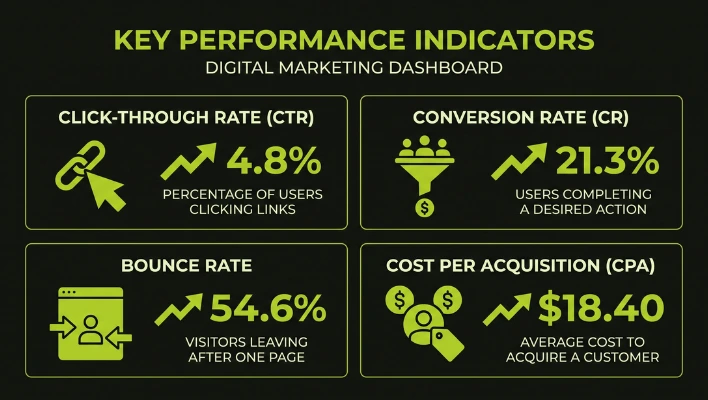
These four KPIs form the foundation of campaign performance reporting. Most businesses only need these to start.
Click Through Rate
Click through rate measures how many people click your link after seeing it. Divide clicks by impressions, then multiply by 100. A higher rate usually signals that your message matches what your audience wants to see.
Conversion Rate
Conversion rate measures how many visitors complete your desired action. Divide conversions by total visitors, then multiply by 100. This number tells you whether your traffic is actually useful, not just plentiful.
Bounce Rate
Bounce rate measures how many visitors leave after viewing only one page. A high bounce rate often points to slow load times, confusing layout, or a mismatch between your ad and your landing page. Lower bounce rates generally mean stronger engagement.
Cost Per Acquisition and Cost Per Lead
Cost per acquisition tells you how much you spend to gain one paying customer. Cost per lead tells you how much you spend to gain one lead. Divide your total campaign spend by the number of acquisitions or leads. These two numbers reveal whether your spending matches the value you receive.
Measuring Return on Investment the Right Way
Return on investment ties your marketing spend directly to profit. It answers the question every business owner asks first, did this campaign make money.
ROI Formula and a Worked Example
ROI equals net profit divided by cost of investment, multiplied by 100. If a campaign costs 1,000 dollars and generates 3,000 dollars in revenue, your net profit is 2,000 dollars. Divide 2,000 by 1,000, then multiply by 100. That gives you an ROI of 200 percent.
ROI vs ROAS: What’s the Difference
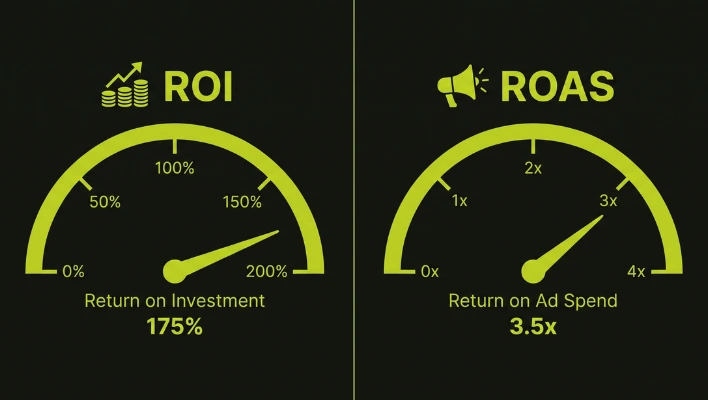
ROI looks at total profit after all campaign costs. Return on ad spend looks only at revenue compared to ad spend, without subtracting other costs. Use ROI when you want the full financial picture. Use ROAS when you want a quick read on advertising efficiency alone, especially for paid campaigns. If your ROAS numbers feel low, our guide on how to optimize Google Ads performance walks through the exact levers that raise it.
Sales Attribution: Connecting Marketing Activity to Revenue
Sales attribution shows which marketing touchpoint actually led to a sale. Without it, you cannot tell which channel deserves credit, or budget, for your results.
Common Attribution Models
First touch attribution gives full credit to the first interaction a customer had with your brand. Last touch attribution gives full credit to the final interaction before purchase. Multi touch attribution spreads credit across every touchpoint along the way. Each model tells a different part of the story.
Choosing an Attribution Model for a Small or Medium Business
Smaller businesses with shorter sales cycles often do well with last touch attribution, since it is simple to track and easy to explain. Businesses with longer sales cycles, such as those selling higher priced services, benefit more from multi touch attribution, since several touchpoints usually lead up to the sale. Pick the model that matches how your customers actually buy, then stay consistent with it.
Building a Marketing Dashboard for Ongoing Performance Reporting

A marketing dashboard pulls your KPIs into one view, so you stop checking five different platforms to understand one campaign. This becomes the center of your performance reporting process.
Benchmark Table: What Good Looks Like by Metric
| Metric | General Benchmark |
| Click Through Rate | 2 to 5 percent for most search and display ads |
| Bounce Rate | 25 to 40 percent is considered strong |
| Conversion Rate | 2 to 5 percent for most landing pages |
| Email Open Rate | 20 to 30 percent across most industries |
These ranges shift by industry, so treat them as a starting point, not a fixed rule. Compare your own results over time, since your past performance is the most reliable benchmark you have.
How Often to Review Your Dashboard
Weekly reviews work well during an active campaign. Monthly reviews work well for long term tracking. Quarterly reviews suit big picture decisions, such as budget planning. Pick a rhythm and stick to it, since steady reporting makes trends easier to spot.
Keeping Your KPI Tracking Reliable Over Time
Reliable measurement depends on consistency, not extra tools. Lock in your KPIs before a campaign starts, then keep them unchanged for the full campaign length, since switching midway makes results impossible to compare. Limit your dashboard to the metrics tied to your actual goal, since extra numbers tend to distract more than they inform.
According to the official Google Analytics help documentation, properly configured conversion tracking is the foundation for accurate campaign reporting across every channel. Confirm your setup matches that standard before trusting any number your dashboard shows.
Frequently Asked Questions
How do you measure digital marketing success?
You measure digital marketing success by setting clear goals first, then tracking KPIs tied to those goals, such as conversion rate, cost per acquisition, and return on investment. Review these numbers in one dashboard and compare them against your own past performance.
What is the difference between a metric and a KPI?
A metric is any number you can track, such as page views. A KPI is a metric directly tied to a business goal, such as conversion rate or revenue per lead. Every KPI is a metric, but not every metric deserves to be a KPI.
What is a good click through rate for digital marketing?
Most search and display campaigns see a strong click through rate between 2 and 5 percent. Email campaigns often perform higher, depending on the industry and audience.
What is a good bounce rate for a website?
A bounce rate between 25 and 40 percent is generally considered strong for most websites. Rates above 70 percent often signal a mismatch between your ad and your landing page content.
How is ROI calculated in digital marketing?
ROI equals net profit divided by the cost of investment, multiplied by 100. This formula tells you the percentage return you earned on every dollar spent.
What tools are used to measure digital marketing performance?
Google Analytics remains the most widely used tool for tracking website traffic and conversions. Many businesses pair it with a dedicated marketing dashboard to combine data from ads, email, and social platforms in one place.
How do you measure social media marketing success?
Social media success is measured through engagement rate, click through rate to your website, and conversions tied to social campaigns, not follower count alone. Connecting social platforms to your main analytics tool gives a clearer picture of actual impact.
How do you measure content marketing success?
Content marketing success is measured through organic traffic growth, time spent on page, and conversions generated from content-specific landing pages. Search rankings for target keywords also signal whether your content strategy is working.
Final Thoughts
Measuring digital marketing success does not need to be complicated. Pick clear goals first, then track a short list of KPIs that connect directly to those goals. Set up your analytics before any campaign launches, not after. Review your numbers on a steady schedule, and compare them against your own past results instead of chasing industry averages alone.
The businesses that get the clearest picture of their marketing are the ones that stay consistent with their tracking, not the ones that track the most numbers. Start with conversion rate, cost per acquisition, and return on investment. Add other KPIs only when you have a clear reason to watch them.

Wali Shah is the Founder and CEO of SkillsHeaven, a digital growth agency specializing in Local SEO, Google Ads, and conversion-focused website development. With over 8+ years of experience, he has helped scale 170+ businesses, including 93+ limousine companies globally, by building structured, lead-generating digital systems. His expertise spans local search optimization, paid media strategy, and high-performance website development, all aligned with measurable business growth. Known for a data-driven and ethical approach, Wali focuses on creating scalable marketing systems that increase visibility, generate qualified leads, and drive long-term revenue for service-based businesses.