
Understanding what should an SEO report include is one of the first things every SEO professional needs to get right before sending a report to a client. A poorly structured report loses clients, while a well-built one helps retain them for years.
This guide explains the essential components of an effective SEO report, how to forecast SEO results, present projections to stakeholders, and build a scalable reporting system for multiple clients. By the end, you’ll know what to include in an SEO report, how to forecast SEO traffic using a proven model, and how to create reports that clearly demonstrate the value of SEO.
What Is an SEO Report
An SEO report is a structured document that communicates the performance of a website’s organic search presence over a defined period. It pulls data from tools like Google Analytics 4, Google Search Console, Ahrefs, and Semrush to give a clear picture of what is working, what is not, and what needs to happen next.
A good SEO report is not a data dump. It is a curated performance narrative built around the client’s business goals.
There are two types of reports most agencies and freelancers produce:
- Internal reports are used by the SEO team to track technical progress, crawl health, and campaign execution. They are detailed, granular, and operational.
- Client-facing reports are designed to communicate value to decision-makers. They prioritize business outcomes over technical jargon.
Knowing which type you are writing, and for whom, is the first step before you learn how to create an SEO report that actually gets read.
Quick Answer: What Does an SEO Report Look Like?
An SEO report typically includes an executive summary, organic traffic data, keyword ranking movement, backlink profile overview, technical SEO health, conversion tracking, and a forecasting section with next steps. Most professional reports are delivered as a Looker Studio dashboard, a PDF, or a branded document sent monthly. A well-formatted report runs 5 to 10 pages in PDF or a single scrollable dashboard, using charts, comparison tables, and short explanatory paragraphs rather than walls of raw data.
Why SEO Reporting Matters
Most SEO professionals underestimate how much a report influences client retention. Clients do not cancel because results are slow. They cancel because they feel uninformed, confused, or unconvinced that progress is happening. A consistent, well-presented monthly SEO report solves all three problems.
Here is what strong SEO reporting does for your business:
- Builds credibility by showing you track everything systematically
- Manages expectations by setting benchmarks early
- Justifies the retainer by connecting SEO activity to business outcomes
- Creates buy-in for new strategies by showing past results as proof
Learning how to make SEO reporting impactful is not about adding more data. It is about presenting the right data to the right audience in the right format. Every report you produce is also a direct reflection of your E-E-A-T signals as an SEO professional. Clients judge your expertise by how well you communicate results, not just by the results themselves.
The 12 Essential Sections of an SEO Report
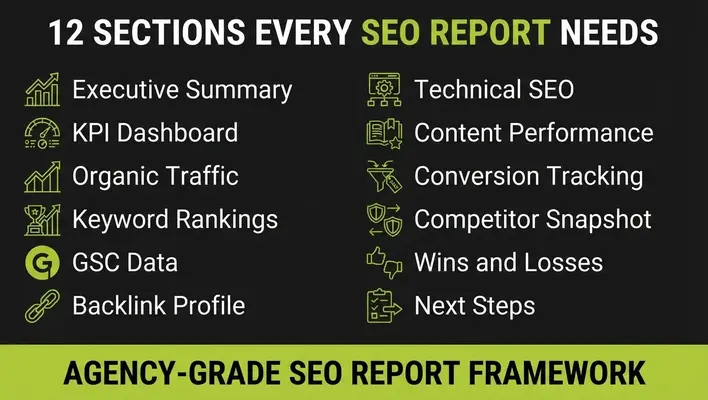
This is the core question: what should an SEO report include to cover all bases without overwhelming the reader? Here is the definitive 12-section structure used by professional SEO agencies.
1. Executive Summary
The most important section and the most commonly written poorly. It should answer three questions in 100 words or less: What happened this month? Why did it happen? What comes next? A business owner should be able to read only this section and understand whether SEO is working.
2. KPI Dashboard
List the agreed SEO KPIs at the top: organic sessions, keyword ranking positions, conversion rate from organic, and backlink growth. Whatever was agreed during onboarding goes here. Defining KPIs before reporting begins is one of the most overlooked steps in the entire workflow.
3. Organic Traffic Performance
Pull data from Google Analytics 4 to show session trends, new user growth, and engagement rate from organic channels. Always compare month over month and year over year. A single month of data with no comparison means nothing to a client.
4. Keyword Rankings
Show movement in target keyword positions. Highlight wins, flag drops, and explain the causes. A table with current position, previous position, and search volume gives clients a quick visual snapshot. A focused keyword targeting strategy also makes this section far easier to report on, because every tracked term maps to a specific page.
5. Google Search Console Data
Show total impressions, average CTR, and click volume. This section proves organic visibility beyond just rankings and is one of the most credible data sources you can reference because it comes directly from Google.
6. Backlink Profile
Report on new referring domains acquired, lost links, and domain authority movement tracked through Ahrefs or Semrush. Quality matters more than quantity, and understanding the different types of backlinks helps clients see why one link from a relevant authoritative domain is worth more than twenty low-quality directory links.
7. Technical SEO Health
Cover Core Web Vitals scores, crawl errors, index coverage issues, and site speed changes. Reference Google Search documentation when explaining technical fixes to give your recommendations additional credibility.
8. Content Performance
Show which pages are driving the most organic traffic, which new content pieces have started ranking, and which existing pages need optimization based on search intent alignment. This section demonstrates topical authority progress over time.
9. Conversion Tracking
Connect organic traffic to business outcomes. Use GA4 goal completions or eCommerce revenue to show revenue attribution from SEO. This is what separates average reports from great ones. Mapping this data against your SEO funnel shows exactly where visitors turn into leads, because rankings and traffic mean very little if the client cannot see a connection to revenue.
10. Competitor Snapshot
A brief look at one or two competitor movements in rankings or backlinks. This adds strategic context without turning the report into a full competitor audit.
11. Wins and Losses Summary
A transparent section that acknowledges what went well and what did not. Clients respect honesty, and this section builds long-term trust faster than any amount of positive spin.
12. Recommendations and Next Steps
Every report must end with a clear action list. What will be done next month and why? This section transforms a backward-looking report into a forward-looking strategy document and is the single most important thing you can include in monthly SEO reports.
How to Read an SEO Report
Teaching clients how to understand an SEO report is part of your job. Include a short reading guide at the top of the reports you send:
- Start with the executive summary. If numbers are green, things are moving in the right direction. If red, read the explanation to understand why and what is being done.
- Look at traffic trends, not totals. A month with fewer sessions but higher conversions is a better month than high sessions with no leads.
- Check rankings for your most important terms. Position movement is the leading indicator of future traffic growth.
- Read the next steps section to know what the SEO team will focus on next.
Clients who know how to read SEO reports become better clients. They ask sharper questions, set realistic expectations, and are far less likely to make reactive decisions based on a single month of fluctuation.
How to Make SEO Reporting Impactful
Most SEO reports are read once, skimmed, and forgotten. The ones that drive decisions and retain clients all share one characteristic they tell a story, not a data dump.
Lead With the Business Narrative, Not the Metrics
Before showing a single number, write one paragraph answering: what is the most important thing that happened this month and why does it matter to this client’s business? A client does not care that impressions increased 22 percent. They care that their business appeared in front of more potential customers this month than last month. Say that instead.
Apply the “So What” Filter to Every Metric
Before including any number in a client facing report, ask: so what does this mean for the client’s business? If you cannot answer that in one sentence, the metric does not belong in the report.
Organic sessions up 18 percent. So what? Approximately 340 more potential customers visited the site this month compared to last month.
Use Visual Hierarchy to Guide the Reader
Place the most important number first and make it visually dominant. Use color consistently: green for positive movement, red for drops, grey for neutral. A reader should understand the report’s main message in 15 seconds of scanning.
End With a Decision, Not a Summary
The last section of every impactful report is not a recap of what happened. It is a clear statement of what will happen next and what decision, if any, the client needs to make. Clients who feel like active participants in the strategy stay longer than clients who feel like passive recipients of a monthly document.
How to Make a Nice Looking SEO Report
A well-designed report gets read. A cluttered report gets closed. Follow these principles:
- Use Looker Studio for live reports. Full control over colors, fonts, and layout. Mix bar charts, line graphs, scorecards, and tables to break up visual monotony.
- Keep layout consistent. Every page: section title at top, key metric scorecard, chart or table in center, 2 to 3 sentences of explanation at the bottom. Clients read faster when they know where to look.
- Use color with purpose. Green for positive, red or orange for declines, grey for neutral. Never use more than 3 colors in a single chart.
- Respect white space. A cluttered report looks like the creator was justifying their fee by volume. A clean report signals confidence.
- Add a branded cover page and table of contents for PDF reports. It immediately signals professionalism.
How to Get a Website SEO Report
Here are the five fastest ways to generate a complete SEO report for any website:
- Google Search Console: Open the Performance report, set the date range, and export clicks, impressions, average CTR, and average position by query and page. The most accurate organic visibility data available, at zero cost.
- Google Analytics 4: Navigate to Reports → Acquisition → Traffic Acquisition, filter by Organic Search, and export sessions, engaged sessions, conversions, and revenue.
- Ahrefs or Semrush: Enter any domain into Site Explorer or Domain Overview for estimated organic traffic, top keywords, backlinks, and traffic value. This is how to get a report for sites you do not have GSC access to, including competitors.
- Looker Studio: Connect GA4 and GSC as data sources, build a template once, and the data refreshes automatically every month.
- Screaming Frog: Run a crawl to generate a technical report covering titles, meta descriptions, broken links, redirect chains, and canonical issues. Essential for onboarding audits and diagnosing traffic drops.
How to Create an SEO Report
Here is the full production workflow used at agency level.
Step 1: Choose Your Reporting Format
Live data access → Looker Studio. Shareable document → PDF. Budget-limited clients → a well-built Excel report is still practical and professional.
Step 2: Set Up Your Data Connections
Connect Google Analytics 4 and Google Search Console as your primary data sources. Accurate conversion tracking is a prerequisite for any meaningful reporting.
Step 3: Define KPIs Before the First Report
Agree on what success looks like before reporting begins. This prevents misaligned expectations and makes every future monthly SEO report easier to frame.
Step 4: Follow the 12-Section Structure
Use it as a checklist every month. Skip sections only if the data is not relevant to that specific client’s goals or industry.
Step 5: Apply the STAR Narrative Framework
Every section follows: Situation, Trend, Action, Roadmap. This is how to draft an SEO report that reads like a professional strategy document rather than a raw data export, and the fastest way to produce a report non-technical clients can follow without an explanation call.
Step 6: Send Reports With Context
Do not just email a PDF. Include a 3-sentence summary in the email body covering the biggest win, the biggest challenge, and the focus for next month. Clients who get context alongside the report are far more likely to read it fully.
Step 7: White-Label Your Reports
If you are an agency reselling SEO services, remove all tool branding from exports. Use your agency logo, colors, and domain in the report header. A branded report signals professionalism and makes your service harder to replace.
For agencies managing 10 or more clients, build one master Looker Studio template, duplicate per client, and swap the data source. A report that once took 3 hours per client now takes 20 minutes.
How to Create an SEO Report in Excel
Excel is the most accessible reporting tool available and, when built correctly, rivals paid dashboards in clarity.
| Tab Name | Contents |
|---|---|
| Dashboard | KPI summary with conditional formatting |
| Organic Traffic | GA4 channel data by month |
| Keyword Rankings | Position tracking table with movement |
| Backlinks | Referring domain log with DA scores |
| Technical Issues | Crawl error log with priority ratings |
| Content Performance | Page-level traffic and conversion data |
| Forecast | 6-month traffic and lead projection model |
| Notes | Monthly commentary and next steps |
The workflow in brief:
- Dashboard tab: Summary row with 6 key KPIs (organic sessions, conversions, average position, referring domains, Core Web Vitals status, ROI estimate). Conditional formatting: green if improved, red if declined. Add sparklines showing the 6-month trend for each KPI.
- Organic Traffic tab: Paste the GA4 CSV export, build a pivot table summarizing sessions and conversions by month, and add a 12-month trend line chart.
- Keyword Rankings tab: Paste your rank tracking export, add a Movement column, apply conditional formatting, and add filter rows.
- Forecast tab: Build the SVC Forecast System table (covered below) with a line chart showing projected visits over 6 months.
How to Make an SEO Analysis Report
An analysis report differs from a monthly performance report. Performance reports answer: how did we do? Analysis reports answer: why are we here, what is holding us back, and what needs to change? They are produced at onboarding, after a traffic drop, or during quarterly reviews.
Cover five sections:
- Technical analysis: Crawl the site with Screaming Frog or Semrush Site Audit. Prioritize the top 10 issues by estimated traffic impact rather than listing every finding.
- Content analysis: Use GA4 and GSC to find pages with high impressions but low CTR (title optimization opportunity) and high traffic but low conversions (CTA optimization opportunity).
- Backlink analysis: Audit referring domains, authority distribution, anchor text, and toxic links. Compare against the top 3 competitors; the gap in referring domains is your link building target.
- Competitor analysis: Compare keyword overlap, traffic estimates, and content gaps against 3 to 5 direct organic competitors. Content gaps are immediate content opportunities.
- Opportunity discovery: Combine all findings into a prioritized list, each with impact level, effort level, and recommended action. This is what clients actually want: what should we do and in what order.
How to Forecast SEO Results
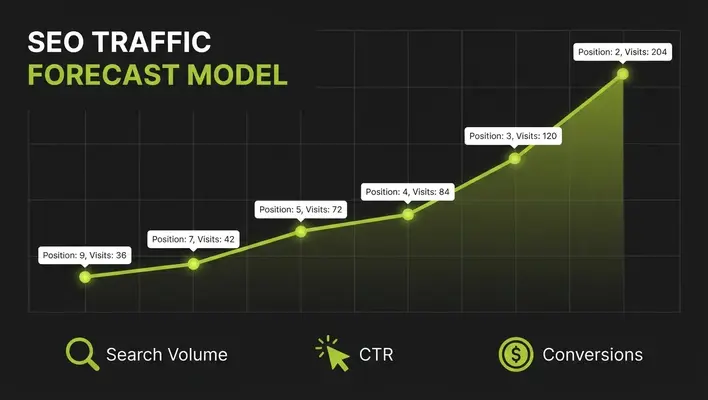
This is where most SEO reports fall short. Forecasting transforms a backward-looking report into a forward-looking business case. Knowing how to predict SEO results is what separates junior reporting from senior strategy.
Here is the original SVC Forecast System (Search Volume, CTR Curve, Conversion Rate).
The Formula:
Projected Monthly Traffic = Target Keyword Search Volume × Expected CTR by Ranking Position
Projected Monthly Leads = Projected Traffic × Site Conversion Rate
CTR Benchmarks by Ranking Position:
| Position | Average CTR |
|---|---|
| 1 | 28% |
| 2 | 17% |
| 3 | 10% |
| 4 | 7% |
| 5 | 6% |
| 6 to 10 | 2% to 4% |
Working Example: Airport Limo Client
Keyword: “airport limo Toronto” | Search Volume: 1,200 per month
For a local business like this, local SEO ranking factors heavily influence how quickly these target positions can realistically be reached.
| Month | Target Position | CTR | Projected Visits | Conversion Rate | Projected Leads |
|---|---|---|---|---|---|
| Month 1 | 9 | 3% | 36 | 3% | 1.1 |
| Month 2 | 7 | 3.5% | 42 | 3% | 1.3 |
| Month 3 | 5 | 6% | 72 | 3% | 2.2 |
| Month 4 | 4 | 7% | 84 | 3% | 2.5 |
| Month 5 | 3 | 10% | 120 | 3% | 3.6 |
| Month 6 | 2 | 17% | 204 | 3% | 6.1 |
This table answers the exact question every client asks: what are we paying for and when will it show results?
Important caveats to always state in the report: Forecasts are directional projections, not guarantees. Search volumes fluctuate seasonally. Algorithm updates affect ranking timelines. Always present forecasts with a confidence range. Saying “we project between 150 and 210 organic visits by Month 6” is more credible than a single hard figure.
How to Forecast SEO Traffic
Accurate traffic forecasting combines three data layers:
Layer 1: Historical Growth Rate
Pull 12 months of organic traffic from GA4 and calculate the average month-over-month growth rate. If traffic grew from 3,000 to 4,200 sessions over 12 months, that is 40% annually, or approximately 3.3% per month compounded. Apply this rate forward with a 20% conservative reduction to account for algorithm variance and competitive pressure.
Layer 2: Content and Link Activity Multiplier
Every active campaign adds measurable lift. Use 5% additional monthly growth for months where two or more new optimized pages are published, and 8% for months with active link acquisition targeting key service pages.
Layer 3: Seasonality Adjustment
Use Google Search Console historical data to identify seasonal peaks and valleys specific to your client’s niche.
| Month | Seasonal Multiplier (Limo and Travel Example) |
|---|---|
| January | 0.85 |
| March | 0.95 |
| June | 1.10 |
| August | 1.15 |
| October | 1.05 |
| December | 1.35 |
Multiply your base projection by the seasonal factor for each month. The final output is a 6 to 12 month forecast table presented alongside actual performance each month. Over time, comparing forecasted to actual results is one of the strongest credibility signals you can show a client.
How to Predict SEO Growth
Can you predict SEO results? Yes, within a reasonable confidence range.
What you can predict with high confidence:
- Direction of movement: A technically healthy site publishing optimized content and acquiring relevant backlinks will grow over 6 to 12 months, even when exact magnitude is uncertain.
- Seasonal patterns: With 12+ months of GSC data, you can predict traffic peaks and valleys with high accuracy.
- Relative ranking velocity: Higher-authority sites rank new content faster. You can estimate whether a page ranks in 60 days or 6 months based on authority and keyword difficulty.
What you cannot predict with precision:
- Exact ranking positions on a specific date
- The impact of future algorithm updates
- Competitor actions
Leading indicators predict future growth: Core Web Vitals improvements, new authoritative backlinks, rising GSC impressions, and freshly indexed content targeting high-value keywords. When several move positively at once, a traffic increase typically follows in 4 to 8 weeks. Lagging indicators confirm growth already happened: session increases, ranking improvements, and conversion changes.
A credible prediction statement looks like this: “Based on the 14 new referring domains acquired this month and the improvement in Core Web Vitals scores, we project a 15 to 20 percent increase in organic sessions over the next 60 days, with target keywords moving from page two to page one positions.”
How to Forecast SEO ROI
Knowing how to forecast ROI from SEO is one of the most powerful skills for agency growth and client retention.
The ROI Forecasting Formula:
Projected Monthly Revenue from SEO = Projected Organic Sessions × Conversion Rate × Average Order Value or Lead Value
Forecasting Scenarios with Confidence Ranges:
| Scenario | Monthly Visits (Month 6) | Projected Leads | Revenue at $800 avg value |
|---|---|---|---|
| Conservative | 120 to 150 | 3.6 to 4.5 | $2,880 to $3,600 |
| Base Case | 150 to 204 | 4.5 to 6.1 | $3,600 to $4,880 |
| Optimistic | 204 to 280 | 6.1 to 8.4 | $4,880 to $6,720 |
Full Example:
- Projected sessions next quarter: 5,000 per month
- Conversion rate: 2%
- Average client value: $800
- Projected monthly revenue: 5,000 × 0.02 × $800 = $80,000
- SEO investment per month: $3,500
- Projected monthly ROI: ($80,000 − $3,500) ÷ $3,500 = 2,186% ROI
Risk factors to disclose in every forecast: Algorithm updates can reset ranking progress. Competitor content investment can slow ranking velocity. Seasonal demand affects traffic regardless of position. Technical issues can suppress rankings even when off-page signals are strong. A brief risk disclosure paragraph protects your credibility and demonstrates professional transparency.
Even with conservative estimates, this model makes the value of SEO undeniable.
How to Present SEO Forecasts to Stakeholders
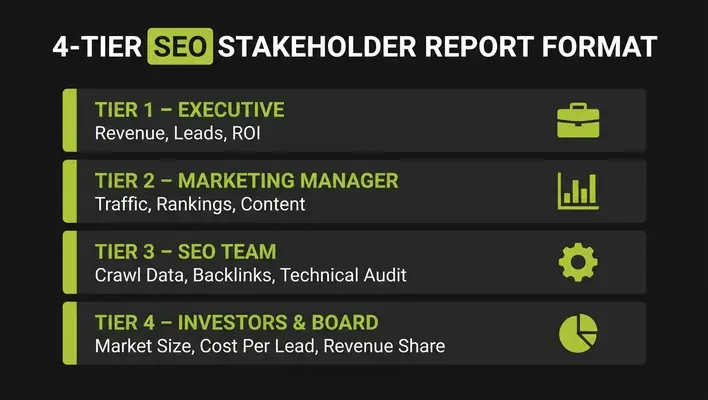
Presenting forecasts is a communication skill as much as a data skill. The most accurate forecast fails if it is presented to the wrong audience in the wrong format.
Tier 1: Executive or Business Owner
Show only revenue impact, lead volume, and growth trajectory. One section with three numbers: current performance, projected performance, and ROI estimate. No technical terminology, no ranking tables. The question they are asking is: is this investment worth it? Answer it directly and stop.
Tier 2: Marketing Manager
Show traffic trends, keyword ranking movement, and content performance. Include the forecasting model with assumptions clearly stated so they can interrogate the numbers and confidently present them to their leadership.
Tier 3: SEO or Technical Team
Show full crawl data, backlink velocity, technical audit results, and detailed position tracking. Core Web Vitals scores, index coverage issues, and log file analysis belong here.
Tier 4: Investors or Board Level
Show market opportunity size, organic traffic as a percentage of total acquisition, cost per organic lead versus paid lead, and projected SEO contribution to annual revenue. Frame SEO as an asset that compounds in value over time rather than an expense to be justified monthly.
Most SEO reports fail because they are written entirely for Tier 3 and delivered to Tier 1 audiences. Restructuring around this model immediately improves how clients respond to your reporting.
How Often Should You Report SEO Progress
- Monthly: The standard for retainer clients. Enough time for meaningful data to accumulate and progress to show.
- Quarterly: Best for executive stakeholders and board presentations, zooming out to strategic trajectory rather than monthly fluctuations.
- Weekly: For active campaign phases like migrations or penalty recoveries. Short 3 to 5 point summaries, not full reports.
- One-time audits: For onboarding or diagnosing traffic drops. Typically 20 to 40 pages for a mid-size site.
The most important rule: agree on the reporting cadence during onboarding, then exceed it consistently. Clients who expect weekly updates and receive monthly ones feel neglected.
How to Check an SEO Report for Accuracy
A report is only as valuable as the data behind it. Run this verification before every delivery:
- Cross-reference GA4 with GSC. Sessions and clicks never match exactly; 10 to 15 percent variance is normal. A 40 percent variance means something is misconfigured.
- Spot-check keyword positions manually. Verify 5 to 10 key terms in an incognito browser against your rank tracker before your client catches a discrepancy.
- Confirm conversion tracking is firing. Run a test conversion in GA4 real-time mode.
- Lock date ranges. Pulling different date ranges for different sections is the most common reporting error.
- Reconcile with CRM data. A significant gap between GA4 organic leads and CRM leads indicates attribution or form tracking issues.
| Check | Tool | Pass Condition |
|---|---|---|
| Organic sessions vs GSC clicks | GA4 and GSC | Variance under 15% |
| Keyword positions spot-checked | Manual and rank tracker | Within 1 to 2 positions |
| Conversions firing correctly | GA4 Real-Time | Test event confirmed |
| Date ranges consistent | All tools | Same period locked |
| CRM lead count reconciled | CRM and GA4 | Gap under 20% |
Common SEO Reporting Mistakes
Knowing what to include in SEO reports is only half the job. Knowing what to remove is equally important.
- Reporting vanity metrics without context. Total impressions and keyword counts mean nothing without conversion data or trend context. Every number needs a “so what” sentence next to it.
- No executive summary. If there is no 100-word summary at the top, decision-makers will not read the rest. This is the single most common reason client reports go unread.
- Not explaining drops. Hiding ranking drops destroys client trust faster than any algorithm update. Address them directly with a cause and a recovery plan.
- No forecast or next steps. A report with no forward-looking section is a history book. Every report must answer: what happens next and why should the client feel confident about it?
- Technical language for non-technical clients. Canonical errors, hreflang issues, and crawl budget waste are internal language. Translate every technical finding into a business impact statement.
- Sending a report with no email context. Attaching a PDF with no summary email is the reporting equivalent of handing someone a book without a cover. Three sentences in the email body takes two minutes and dramatically improves read rates.
Best SEO Reporting Tools
| Tool | Primary Use in Reporting |
|---|---|
| Google Analytics 4 | Organic traffic, conversions, revenue attribution |
| Google Search Console | Impressions, CTR, index coverage, Core Web Vitals |
| Ahrefs | Backlink profile, referring domains, keyword rankings |
| Semrush | Keyword tracking, competitor analysis, site audit |
| Looker Studio | Automated visual dashboard for client delivery |
| Screaming Frog | Technical SEO crawl data for internal reports |
For teams managing multiple clients, Looker Studio connected to GA4 and GSC is the most scalable solution at no additional cost. Build one master template, duplicate per client, and swap the data source. A report that once took 3 hours takes 20 minutes. For clients who prefer documents, export Looker Studio pages to PDF. For budget-limited setups, a well-structured Excel report covers every essential section without a tool subscription.
FAQs
What should an SEO report include?
An SEO report should include an executive summary, organic traffic data from Google Analytics 4, keyword ranking movement, backlink profile overview, Core Web Vitals and technical health, conversion tracking, a competitor snapshot, and a forecasting section with next steps. These sections together give a complete picture of performance and forward direction.
What does an SEO report look like?
A professional SEO report looks like a branded document or live dashboard with charts, comparison tables, and short explanatory paragraphs. It opens with an executive summary, presents data visually, and ends with clear recommendations. Most agency reports run 5 to 10 pages in PDF or appear as a single Looker Studio dashboard.
How do I forecast SEO traffic?
Multiply your target keyword search volume by the expected CTR for your target ranking position, then apply your site’s conversion rate to estimate leads or sales. Layer in a seasonal multiplier for industry-specific peaks and adjust for planned content and link building activity each month.
Can you predict SEO results?
Yes, within a reasonable confidence range. Forecasting models based on search volume data, CTR benchmarks, and historical growth rates produce projections that are typically accurate within 15 to 25 percent. The more historical data available, the more precise the forecast becomes.
How often should SEO reports be sent?
Monthly reports are standard for most retainer clients. Quarterly reports work for executive stakeholders. Weekly updates are used during high-activity campaign phases. The reporting cadence should always be agreed upon during client onboarding.
How do I make an SEO report in Excel?
Export organic traffic data from Google Analytics 4 and keyword data from Google Search Console. Organize each data set in separate tabs. Use pivot tables to summarize traffic by channel, page, and keyword. Add a summary dashboard tab at the front with conditional formatting to highlight increases and drops at a glance.
How do I check an SEO report for accuracy?
Cross-reference organic traffic between Google Analytics 4 and Google Search Console. Verify keyword positions against Ahrefs or Semrush. Confirm conversion data aligns with actual CRM records. Significant discrepancies between tools usually indicate a tracking configuration issue to resolve before the report is finalized.
How do I present SEO forecasts to a client who is not technical?
Use the Tier 1 format: show three numbers only. Current monthly organic leads, projected monthly organic leads in 3 to 6 months, and projected ROI. Add one sentence explaining the assumptions. Skip rankings, impressions, and crawl data entirely for this audience.
How do I generate a monthly SEO report efficiently?
Use Looker Studio connected to GA4 and Google Search Console. Build your template once with all sections pre-configured the data refreshes automatically. Your only manual task is updating the executive summary, wins and losses, and next steps. A report that once took 3 to 4 hours takes 20 to 30 minutes.
How do I manage SEO reporting across multiple clients?
Build a master Looker Studio template with standardized sections. Duplicate it per client and swap only the data source. Keep an internal tracker showing each client’s reporting due date, last delivery date, and key metrics. This system allows one person to handle reporting for 15 to 20 clients without missing a delivery.
How do I forecast traffic growth from SEO for a new website?
Use competitor benchmarks as your baseline. Find 3 competitors ranking for your target keywords using Ahrefs or Semrush and use their estimated monthly organic traffic as your ceiling for the first 12 to 18 months. Apply the SVC Forecast System with realistic timelines: expect 4 to 6 months before meaningful page one rankings appear.
What is the best way to write an SEO report that clients actually read?
Write the executive summary first and keep it under 100 words. Lead with the biggest business outcome, not the biggest SEO metric. Follow the 12-section structure so the report feels complete without being overwhelming. End with a confident next steps section. Reports that are easy to read get read. Reports that require effort to interpret get filed and forgotten.
Conclusion
The question of what should an SEO report include has a clear answer: everything a client needs to understand where they are, why they are there, and where they are heading. Not more. Not less.
The strongest reports follow the 12-section structure, apply the STAR narrative framework to each data point, and lead with a forecast rather than burying it at the end. When you know how to forecast SEO results using the SVC model and present them through the tiered stakeholder format, your reports stop being monthly obligations and start becoming your strongest client retention tool.
For a client who barely reads reports: a sharp executive summary, three key numbers, and a confident next steps section will outperform most agency reports in circulation today. For a data-driven stakeholder: the full 12 sections, the 6-month forecast table, the ROI projection, and a competitor snapshot that contextualizes every metric in business terms.
The format changes by audience. The goal never does. Every report you send should make the client feel informed, confident, and clear on why SEO is worth the investment. And if you would rather have experts handle the entire reporting and growth process for you, our professional SEO services are built around exactly this standard, every single month.

M. Awais Khan is a Business Development and Digital Growth Strategist at SkillsHeaven, specializing in SEO, local search optimization, and performance-driven digital marketing. With experience supporting 100+ businesses, he develops and implements data-driven strategies that help companies increase online visibility, generate qualified leads, and drive sustainable revenue growth. His expertise spans Local SEO, Google Ads, social media marketing, and conversion-focused website optimization, ensuring every project is aligned with measurable business outcomes and long-term success.